Chart types for poll results
PHPPoll draws poll results as animated bar, column, donut or pie charts without any chart library. See examples and learn how to choose the best chart style.
PHPPoll draws all charts itself with CSS and SVG. They are crisp on every screen, adapt to dark mode, need no external library and load instantly. Choose the style per poll in Appearance → Results chart.
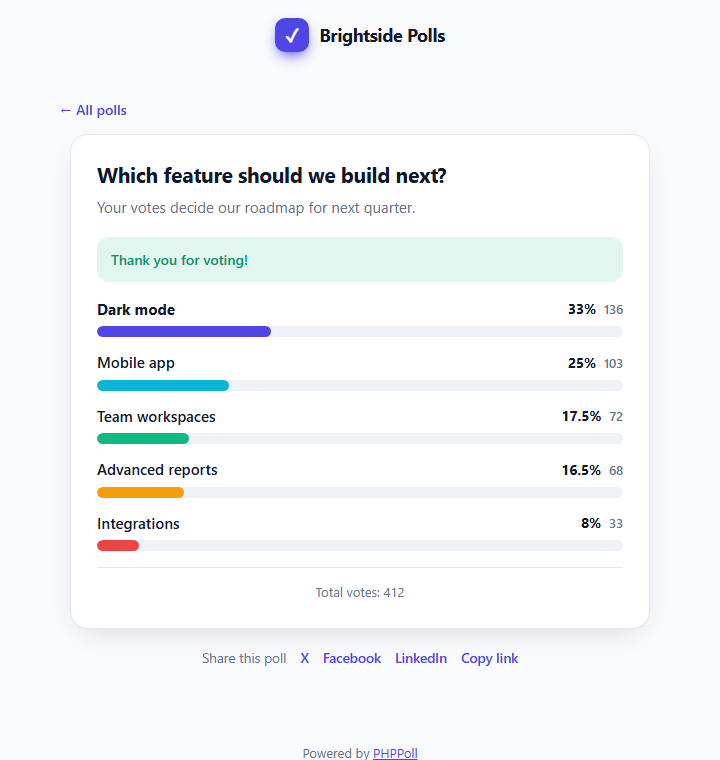
Bars
Horizontal bars with the option name above each bar. The best all-rounder: long answer texts stay readable, and differences are easy to compare. The leading answer is highlighted.
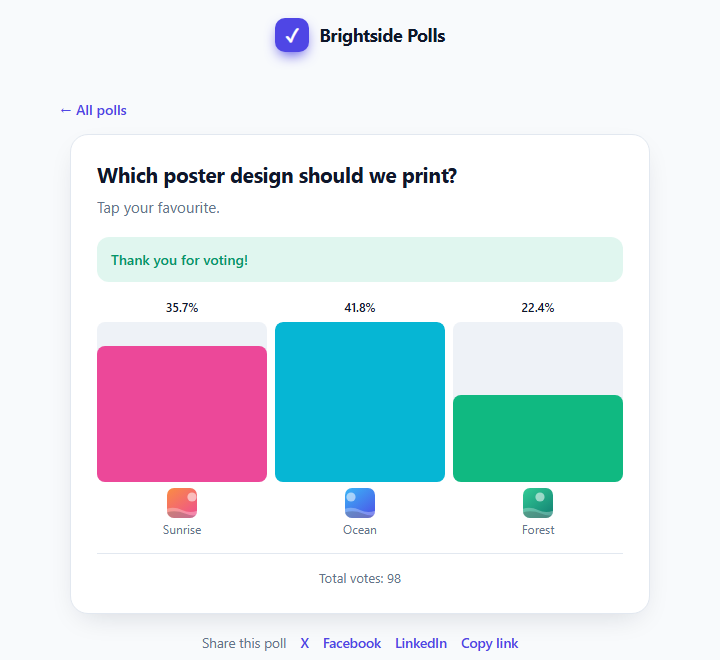
Columns
Vertical columns side by side, scaled to the highest value. Works best with short labels and up to about eight options. Also used for the 0–10 distribution of NPS polls.
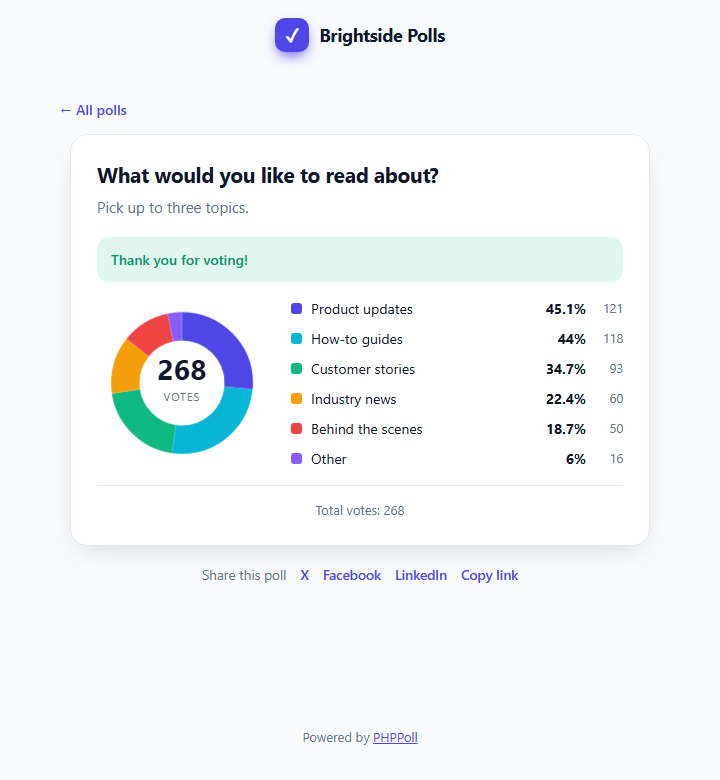
Donut
A ring with the total number of votes in the center and a legend with percentages and counts. Good for showing parts of a whole, such as yes / no / not sure.
Pie
A solid pie chart with the same legend. Ideal for two to five options.

Ratings and NPS
These types have their own result views: the average with stars and distribution bars for ratings, and the score with a colored promoter/passive/detractor bar for NPS. See Star rating polls and NPS (Net Promoter Score) polls.
Which chart should I choose?
| Situation | Recommended |
|---|---|
| Many options or long texts | Bars |
| 3–8 short options | Columns |
| Yes / No / Maybe | Donut or pie |
| Multiple choice (percentages above 100% total) | Bars or columns – a pie would be misleading |
Colors
Each option gets its own color from a balanced palette. The first color follows the accent color of the poll. See Poll appearance settings.
Last updated