Statistics and Reports
The Statistics menu answers four questions: how many people visit, where they come from, what devices they use and which events perform best.
Traffic

Statistics → Traffic shows page views, unique visitors and the daily average for the last 7, 30 or 90 days, with a chart and the list of the most visited pages. Search engine robots are not counted.
Referrals
Statistics → Referrals lists the websites that send you visitors, with counts, and the most recent referring links. Use it to see which partners, social networks or search engines work.
Audience and devices
Statistics → Audience shows the share of desktop, mobile and tablet visits, and of browsers and operating systems. If most visitors use phones, make sure your event images work well on small screens.
Event performance
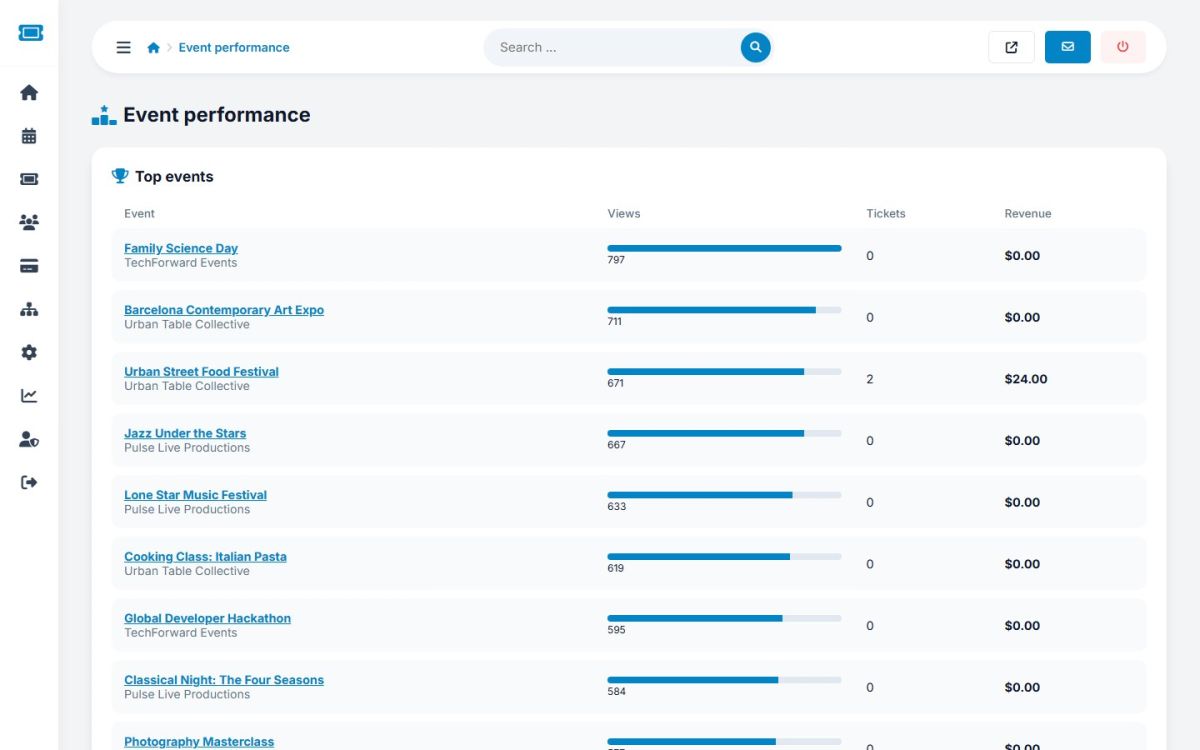
Statistics → Event performance ranks events by page views and shows for each the tickets sold and revenue. A second table counts active events per category. Events with many views but few sales may need better prices, descriptions or images.
Dashboard charts
The dashboard shows a 14 day summary of traffic and ticket revenue. For richer analysis connect Google Analytics in Tracking.
Last updated