The admin panel at a glance
The admin panel has a dark sidebar on the left, a top bar with the date range, and the report in the middle. Everything is reachable in one click.
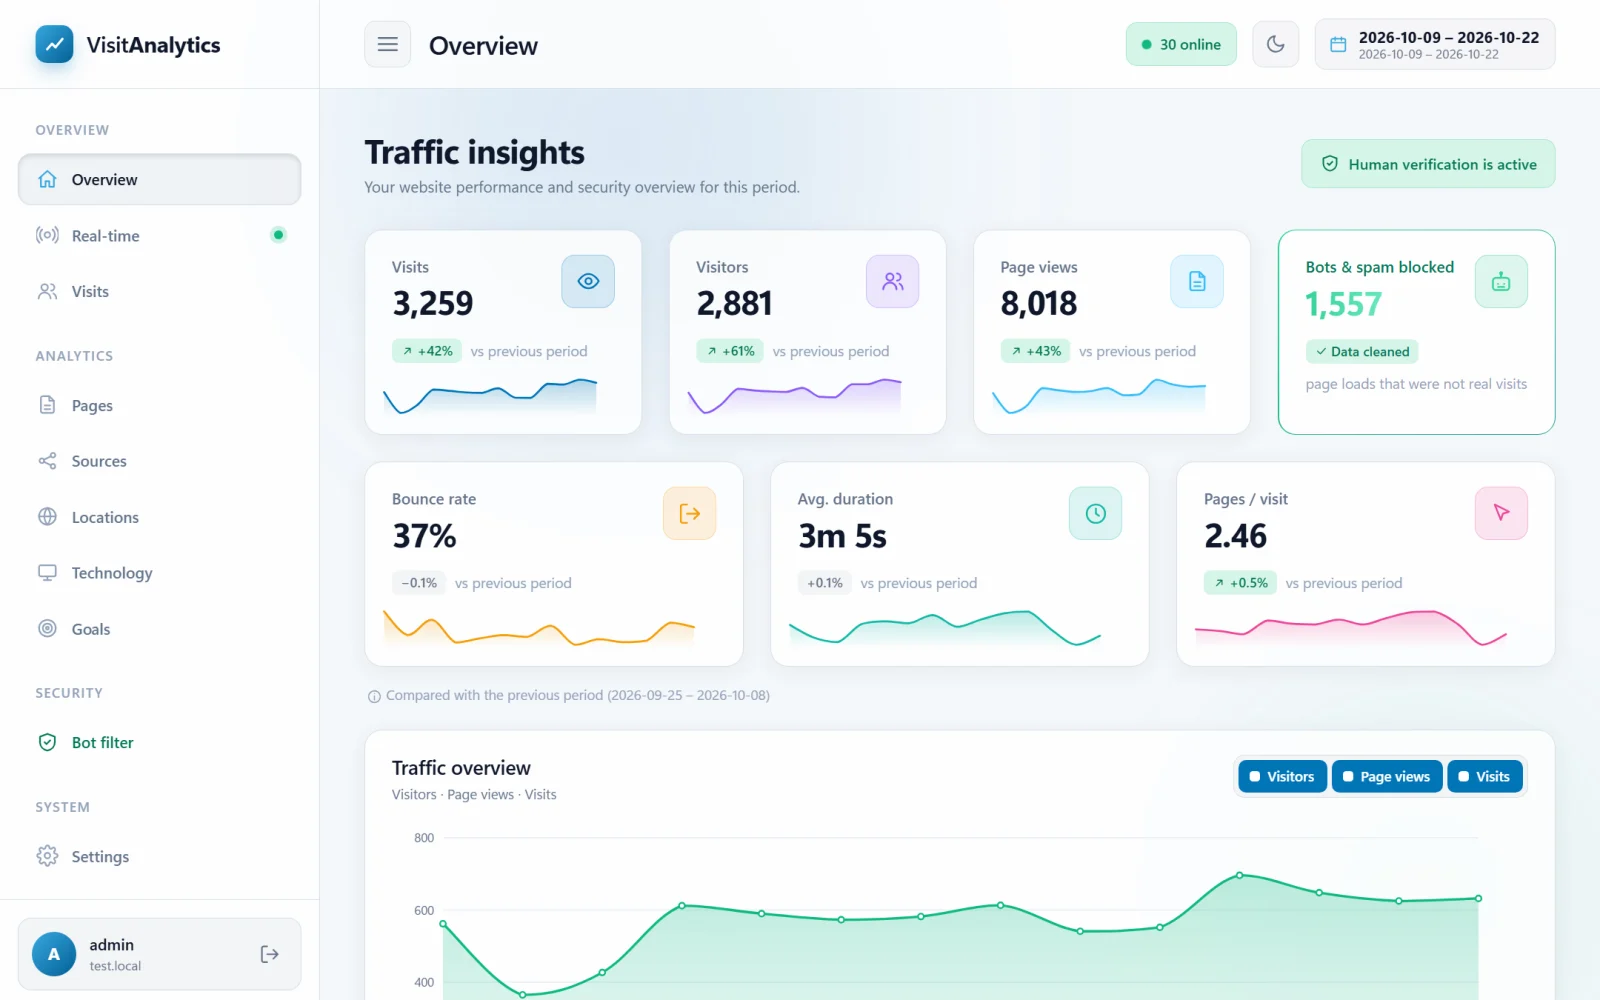
The sidebar menu
| Menu item | Use it to... | Manual |
|---|---|---|
| Analytics | ||
| Overview | See the key numbers, the traffic chart and the best of every report | The Overview report: visitors, visits, page views and bounce rate |
| Real-time | Watch the visitors who are on your website right now | Real-time: see who is on your website right now |
| Pages | Find top, entry and exit pages and broken links | Pages report: most viewed pages, time on page and exit rate |
| Sources | See where visitors come from and measure campaigns | Traffic sources: search, social, email, paid, direct and referral |
| Locations | Countries, languages and time zones of your visitors | Locations: visitor countries, languages and time zones |
| Technology | Devices, browsers, systems and screen sizes | Devices, browsers, operating systems and screen sizes |
| Visits | Browse every single visit and its pages | The Visits log: browse every single visit |
| Manage | ||
| Goals | Define and track conversions | Goals: track conversions such as sign-ups, orders and downloads |
| Bot filter | See what was kept out of your statistics and why | The Bot filter: see which robots were kept out of your statistics |
| Settings | Configure tracking, privacy, data, installation and your account | General settings: website name, language, time zone and date format |
The bottom of the sidebar shows the name of your website and the Log out link. A green number next to Real-time shows how many visitors were active in the last 5 minutes.
The top bar
- Page title – the name of the current report.
- Date range – the period every report is calculated for. See Choosing the date range of a report. It is hidden on Real-time and Settings, which do not depend on a period.
- Online counter – "5 online" means five different visitors viewed a page in the last 5 minutes. Click it to open Real-time.
- Theme button – switches between light and dark mode (Dark mode and using the admin panel on a phone).
Working with the tables
- Click a column title to sort by it; click again to reverse the order.
- Type in the search box above a table to filter its rows instantly.
- Press the CSV button to download the table for Excel or Google Sheets (Export statistics to CSV for Excel and Google Sheets).
- Hover over a chart to see exact values. Click a name in a chart legend to hide or show that line.
Last updated