The Overview report: visitors, visits, page views and bounce rate
The Overview is your daily check-up: six key numbers with trend lines, an interactive traffic chart and the best of every other report on one page.
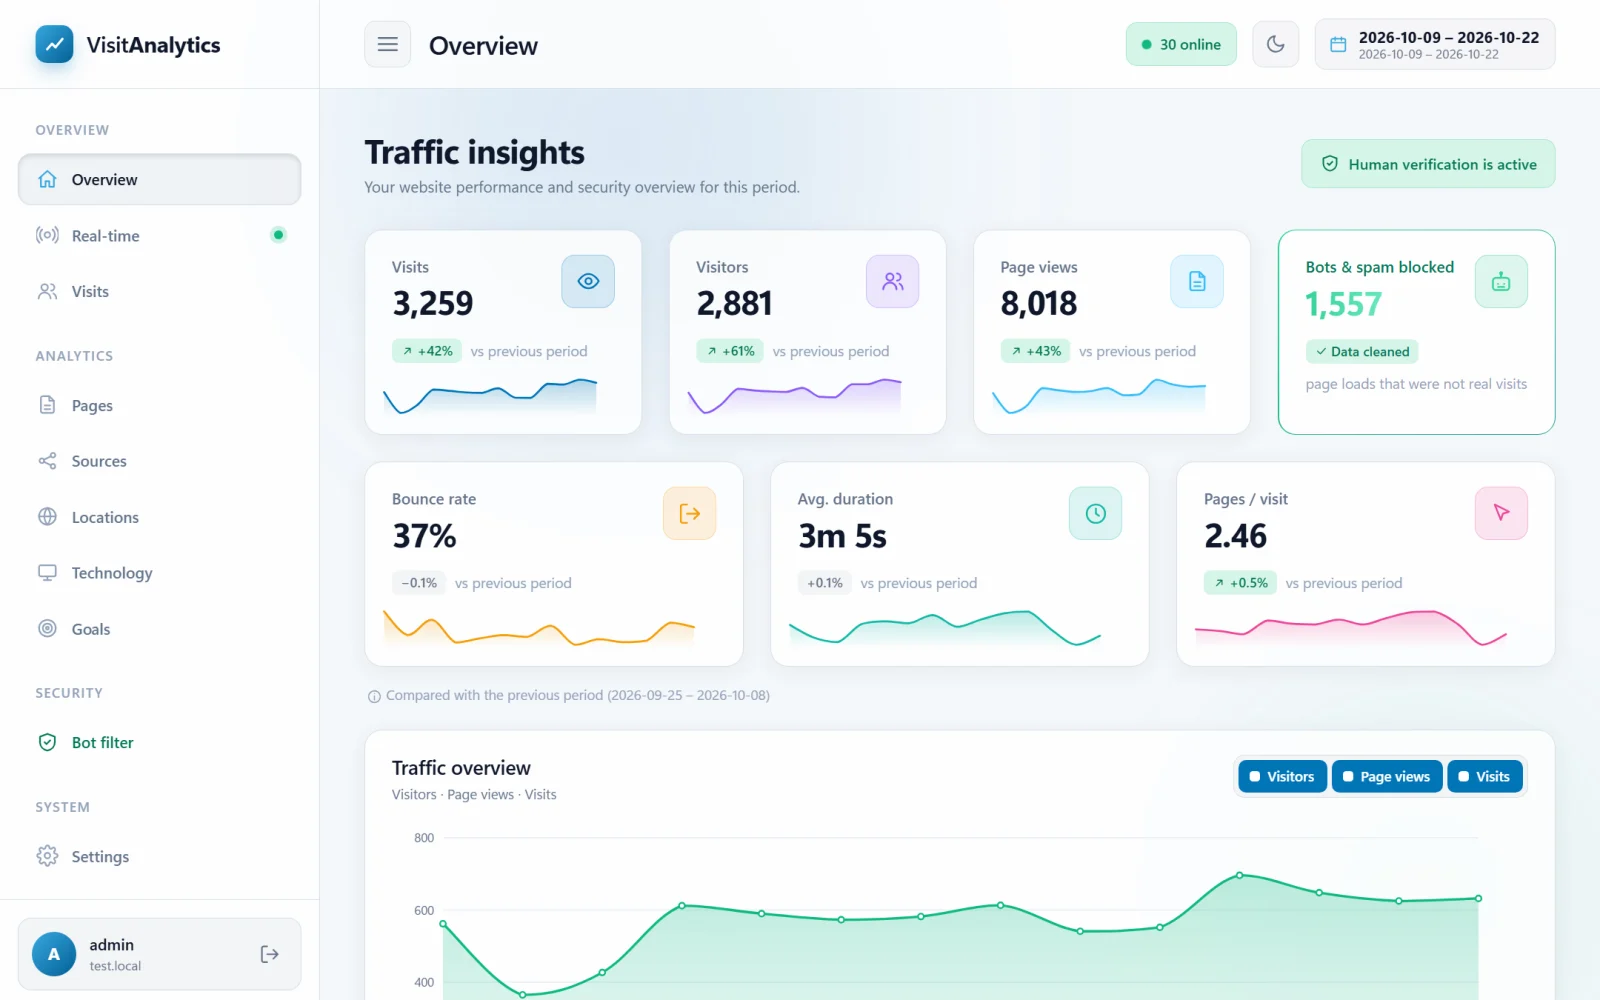
The six key numbers
| Tile | What it counts |
|---|---|
| Visitors | Different people (more exactly: different browser and IP address combinations) who visited in the period. A person who comes ten times is counted once. |
| Visits | Series of page views by one visitor. A visit ends after 30 minutes without activity (you can change this in Tracking settings: bot sensitivity, ignored pages, sessions and more). The same person returning later makes a new visit. |
| Page views | The total number of pages opened. Reloads within a few seconds are ignored. |
| Bounce rate | The share of visits that had only one page view. A lower number is usually better. |
| Avg. visit duration | The average time between the first and last page of a visit. With the beacon the time spent on the last page is added too. Visits with a single page and no beacon data cannot be measured and are left out of the average. |
| Pages / visit | Page views divided by visits. |
Hover over a tile title to read a short explanation. Each tile has a trend line with one point per day and a badge comparing with the previous period (see Choosing the date range of a report).
The traffic overview chart
The big chart shows visitors, page views and visits over time. Move the mouse over it for exact values and click a name above the chart to hide or show a line. For a single day the chart shows hours. More about the other cards on this page in Overview charts: heat map, new vs returning visitors and more.
Highlights
Below the chart you find a few sentences in plain words, for example "Best day: 2026-10-21 with 278 visitors", "Main source: Search engines (33% of visits)" or "56% of visits come from phones and tablets".
No data yet?
If the period is empty, the Overview shows a welcome card with a link to the installation page. See How to add the tracking code to your website and Troubleshooting: no visits recorded, wrong IP, empty reports.
Last updated