Pages report: most viewed pages, time on page and exit rate
The Pages report lists every page of your website that was visited, with the numbers you need to decide which content works.
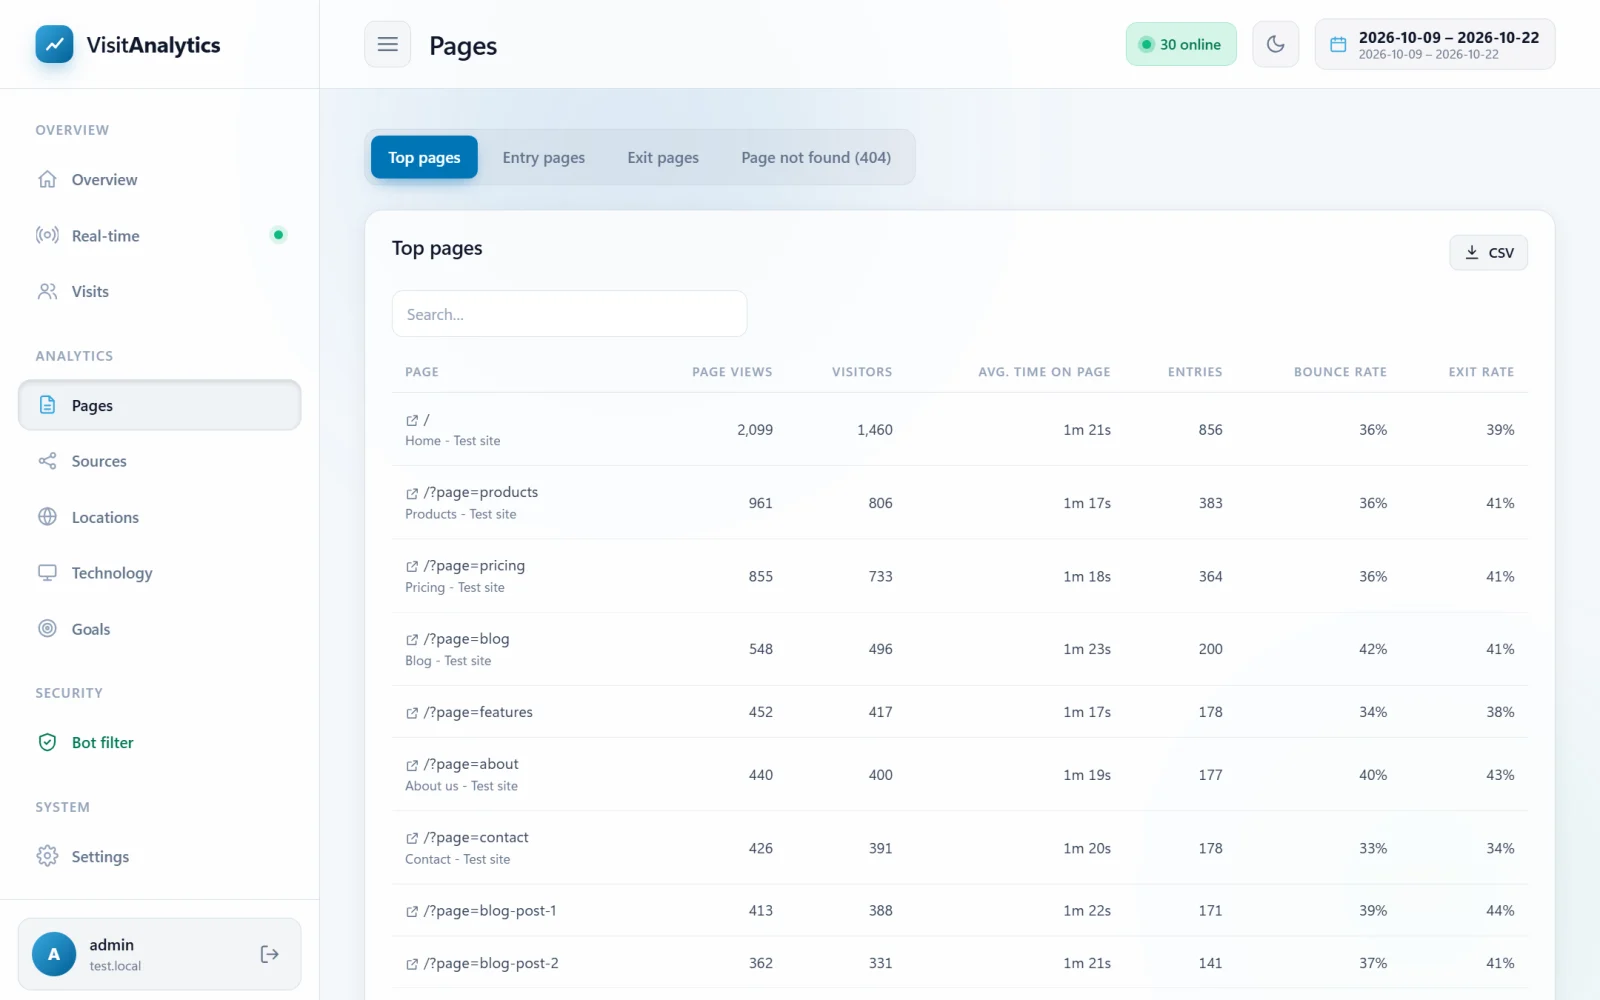
The columns
| Column | Meaning |
|---|---|
| Page | The address of the page (path and query string). Marketing parameters such as utm_source or fbclid are removed, so one page is not split into many entries. If the beacon is on, the page title is shown below the address. |
| Page views | How often the page was opened. |
| Visitors | How many different visitors opened it. |
| Avg. time on page | The time until the visitor opened the next page, or the measured time with the beacon. The last page of a visit can only be measured with the beacon. |
| Entries | In how many visits this was the first page. |
| Bounce rate | Of the visits that started here, the share that left without a second page. |
| Exit rate | The share of the page's views that were the last page of a visit. |
Using the table
- Click a column title to sort, for example by Bounce rate to find weak landing pages.
- Use the search box to filter by part of an address.
- Click the small arrow icon in front of a page to open it in a new tab.
- Press CSV to export all pages (Export statistics to CSV for Excel and Google Sheets). The table on screen shows the top 500 pages.
Reading the numbers
- High views and a high exit rate on a normal article is fine; on a checkout step it is a problem.
- A high bounce rate on an entry page means visitors do not find what they expected – check the source of that traffic in Traffic sources: search, social, email, paid, direct and referral.
- Pages with many views but very short time may have a confusing layout or be mostly navigation.
The other tabs of this report are described in Entry pages and exit pages: where visits start and end and Find broken links with the Page not found (404) report.
Last updated